
India's agricultural transformation since independence stands as one of the most consequential policy interventions in modern history. The introduction of synthetic fertilisers — principally nitrogen (urea), phosphorus (DAP), and potassium (MOP) — underpinned the Green Revolution that propelled a food-deficit nation towards self-sufficiency.
However, five decades of data now reveal a more complex and troubling trajectory. The very inputs that fuelled this agrarian miracle have become embedded in a cycle of diminishing returns, ecological degradation and escalating pest management costs.
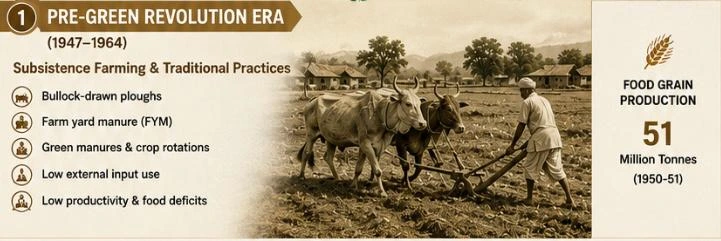
At Independence in 1947, Indian agriculture was characterised by subsistence farming, traditional organic practices and low external input use. Bullock-drawn ploughs, farm yard manure (FYM), green manures and crop rotations formed the backbone of nutrient management.
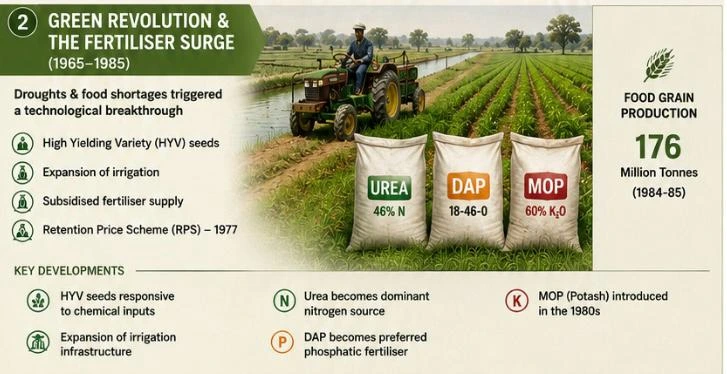
Triggered by consecutive drought years (1965-66, 1966-67) and acute food shortages, the Indian government, with support from international agencies and the Rockefeller/Ford Foundations, embraced the High Yielding Variety (HYV) technology package — new seed varieties responsive to chemical inputs, combined with irrigation expansion and subsidised fertiliser supply.
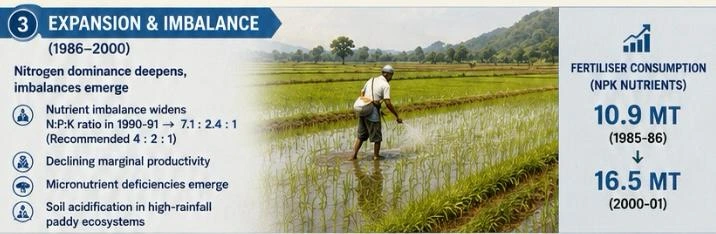
The fertiliser subsidy regime deepened nitrogen dominance. By 1990-91, India's N:P:K ratio had widened to 7.1:2.4:1, far from the recommended 4:2:1. Nutrient imbalance began manifesting in declining marginal productivity, emerging micronutrient deficiencies, and soil acidification.
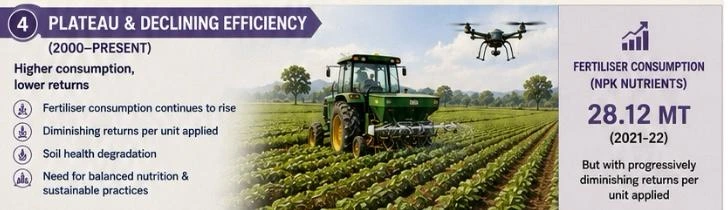
For every 1 kg of fertiliser applied, Indian farmers in the 1960s obtained approximately 12-15 kg of additional foodgrain. By the 2010s, this fertiliser response ratio had fallen to 3-5 kg per kg of fertiliser — a decline of over 65% in productivity per unit input.
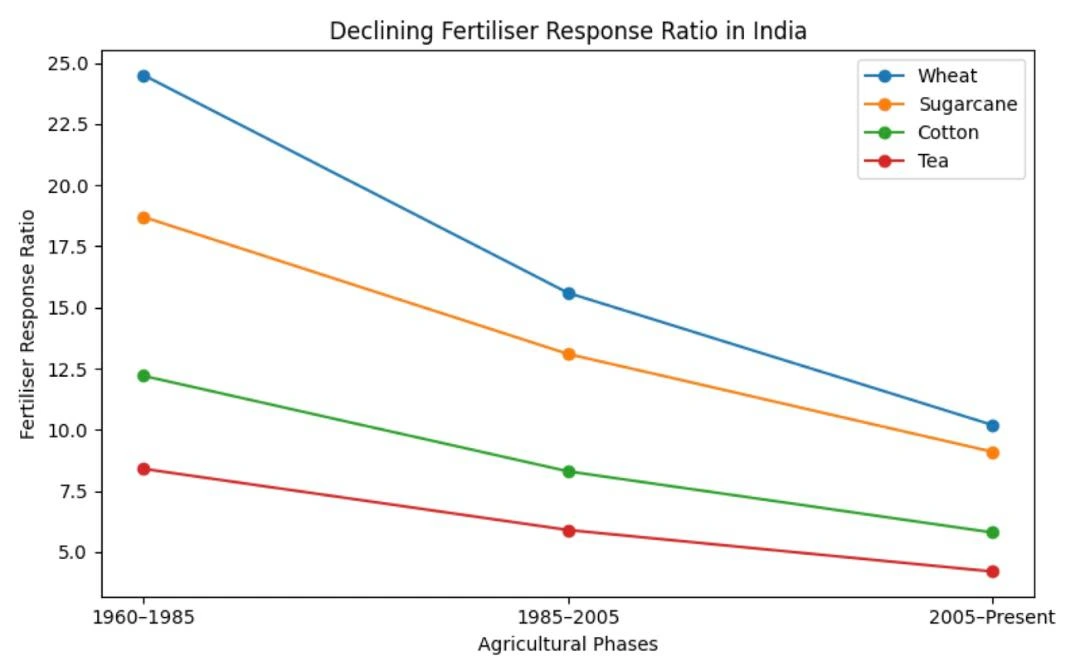
Industrial agriculture treated soil only as a production machine instead of a living ecosystem, hence agriculture became heavily dependent on external chemical inputs.
The declining Fertiliser Response Ratio clearly demonstrates that agriculture cannot depend entirely on chemical inputs forever.
Source: Indian Council of Agricultural Research (ICAR), Govt. of India Reports